

Start with the dates on the chart
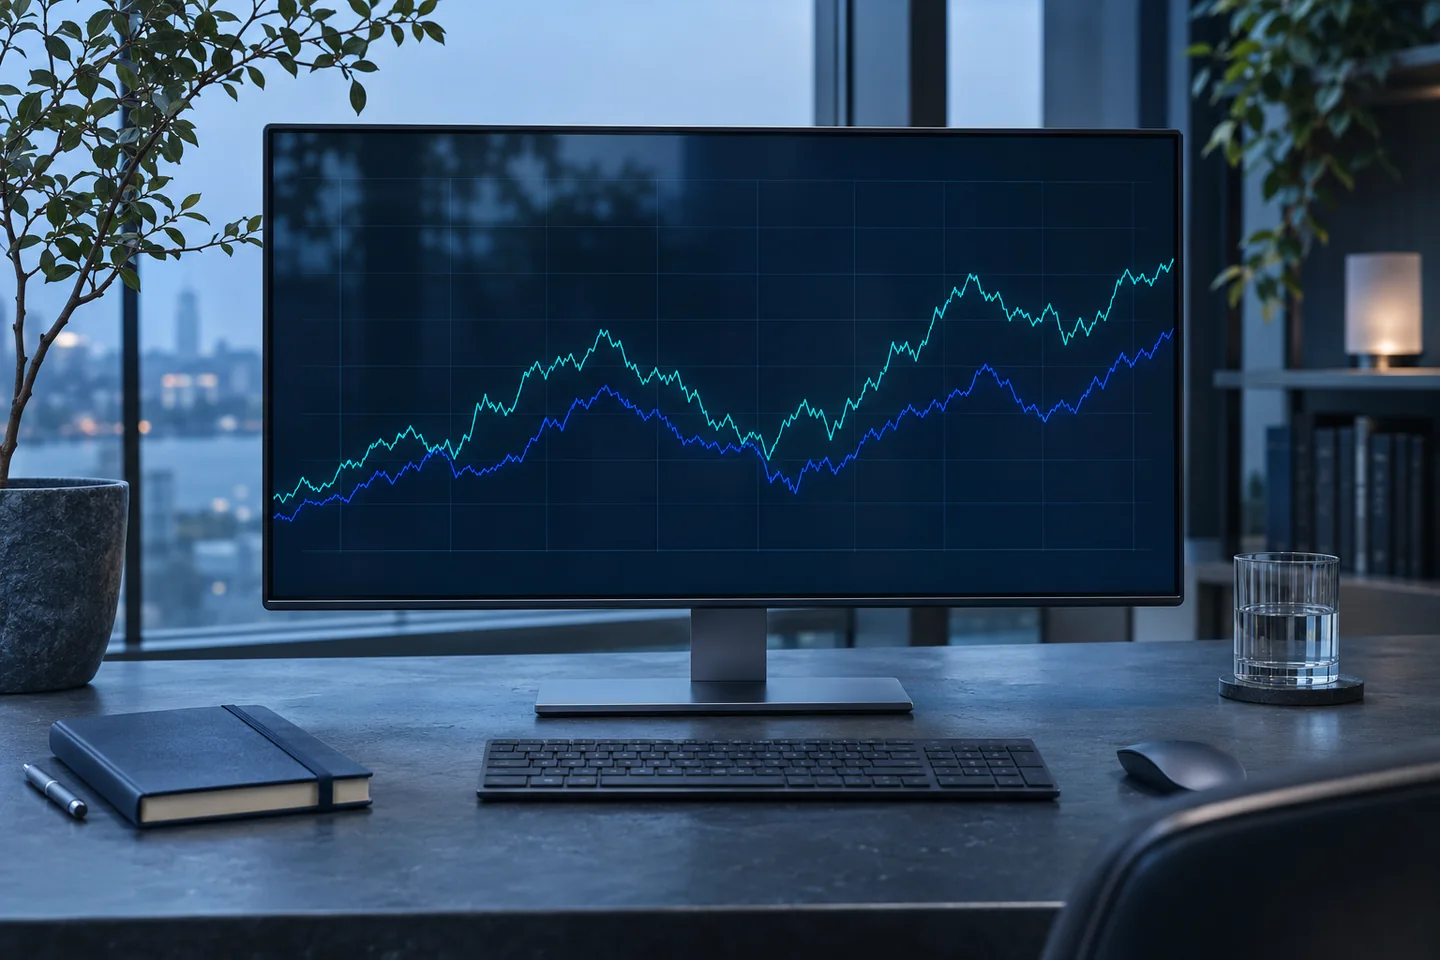
Open Alpha and pick a period, such as the past month or the year so far. Follow the portfolio line to see when it rose and when it fell. The line shows the changes along the way and where it finished.
Check the update date near the chart when you want to know how recent the numbers are. The same portfolio can look quite different over a week and over a full year.
Compare with the market over the same period
Alpha shows the tracked portfolio next to the Nasdaq and S&P 500, two common measures of the stock market. Keeping the dates the same makes it easier to see whether the lines moved together or took different paths.
For example, if all three lines fell during the same stretch, you can see that the portfolio’s drop happened alongside a broader decline. The size and shape of each move give you more context.
See what a backtest means
A backtest takes an investment strategy’s rules and applies them to older market data. In Alpha, you can see the period the simulation covers and how the strategy would have done under those conditions.
The portfolio chart tracks results from the period it has been followed. The backtest describes a simulated past. Keep the date ranges in view when you look at the two sections.
Look at the biggest drop along the way
Imagine a value rising from 100 to 120, then falling to 96. From that high of 120, it fell 20 percent. If that was the biggest fall from a high during the entire period, it is the maximum drawdown.
Alpha shows this number alongside the simulated return. The two numbers help describe what the strategy gained and how bumpy the path was. A positive result at the end can still include a large setback along the way.
Read the results together
The annualized return shows a steady yearly rate that would have produced the same overall change. The period and largest drop tell you more about what happened along the way. Read all three when you look at Alpha’s historical results.
The history is a starting point for research. Future markets can behave differently, so use the chart to understand what happened in the period shown.